Wazuh Security Monitoring & Incident Response Project

This project demonstrates the deployment, configuration, and use of Wazuh as a SIEM solution. The environment includes both physical and virtual machines, integrating multiple tools and data sources to provide advanced threat detection, vulnerability management, file integrity monitoring, and automated incident response. The architecture integrates multiple tools, data sources, and defensive techniques to simulate a realistic, security monitoring setup.
Table of Contents
- What is Wazuh?
- Environment Setup
- Vulnerability Detection
- File Integrity Monitoring
- Threat Hunting
- Active Response
- References
What is Wazuh?
Wazuh is a powerful open-source security platform designed for threat detection, visibility, and compliance. It provides a framework for collecting and analyzing data from various sources in real-time. Wazuh is widely adopted in enterprise environments due to its flexibility, scalability, and integration capabilities, making it a commonly used tool for modern Security Operations Centers (SOCs).
Environment Setup
In this project, both virtual and physical machines were used. A network in the 192.168.88.0/24 subnet was created, with the MikroTik router acting as a DHCP server. The Wazuh Manager has a static IP assigned to it so that the connection between agents and the manager can be reestablished if lost.
 Figure 1: Detailed network topology diagram illustrating the network architecture
The following components are used in this project:
- Wazuh Server/Manager: Installed on Ubuntu 22.04 (VM)
- Agents:
- Windows 11 (physical)
- Ubuntu Linux (VM)
- Network devices: MikroTik router
- IDS: Suricata on Ubuntu agent
Wazuh Manager Setup
Wazuh typically operates with two types of machines:
- Agents installed on endpoints (Linux, Windows, macOS) collect data and monitor systems.
- A Manager processes and correlates this data using detection rules and decoders.
To set up the Ubuntu machine as a Wazuh Manager, the Wazuh installation assistant is needed. Download it using the following command:
curl -sO https://packages.wazuh.com/4.12/wazuh-install.shThen, use the following command to install the Wazuh server:
bash wazuh-install.sh -aAfter running this command, the credentials to access the Wazuh dashboard will be displayed at the end of the execution.
The dashboard is located at: https://
Adding Agents
Wazuh provides two ways to add agents: either via the GUI or the CLI. To add agents via the CLI, the manage_agents script located at /var/ossec/bin/ is used. In this project, I used both methods to add agents. Once the agents are added, they can be seen in the Wazuh dashboard.
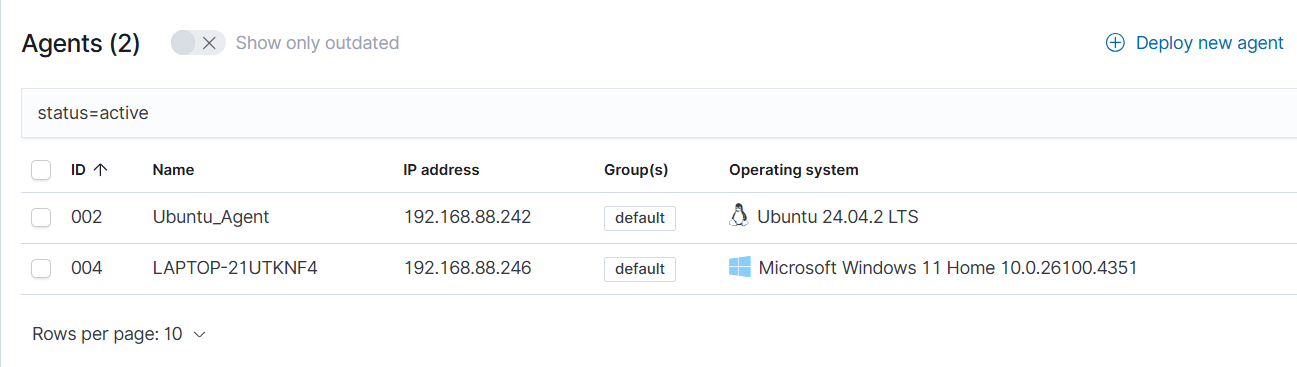 Figure 2: Agents on Wazuh Dashboard
Vulnerability Detection
This feature is activated by default on all agents. Upon clicking on an agent, a dashboard is displayed. In this dashboard, there is a Vulnerability Detection section. Most vulnerabilities arise from outdated versions of programs; hence, it is advisable to either remove those packages or update them to their latest versions.
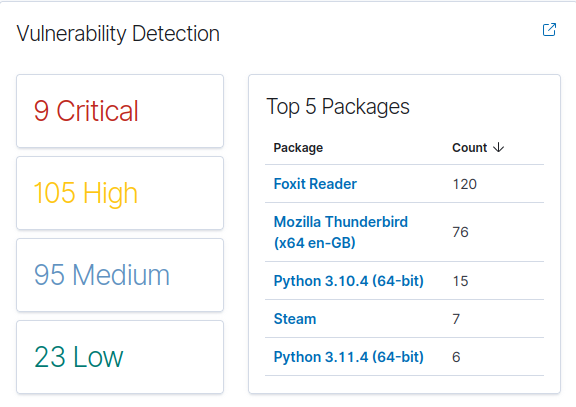 Figure 3: Vulnerability Detection on agent
File Integrity Monitoring
File Integrity Monitoring (FIM) allows you to track changes to critical system files or configurations. I enabled this on the Windows machine by editing the C:\Program Files (x86)\ossec-agent\ossec.conf file. To edit these files, you must be an Administrator or Root, depending on your system. Sometimes this function is already enabled, but if it isn’t, make sure that these lines are present:
<syscheck> <disabled>no</disabled>Afterwards, the directories to be monitored need to be specified. This can be done with the following line:
<directories><FILEPATH_OF_MONITORED_FILE></directories>In my case, FIM was already enabled, so I decided to test it. Usually, the system check is executed every 12 hours, but for testing, I changed this to 60 seconds to see quick results. Then, I added a random host in the hosts file to observe a change.
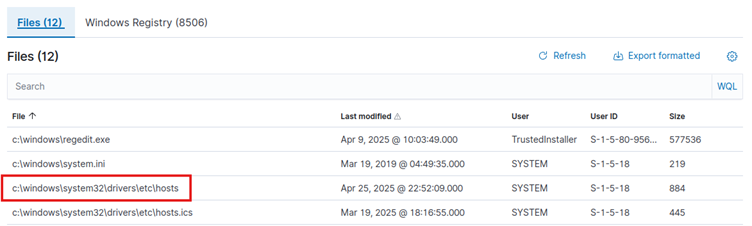 Figure 4: File Integrity Monitoring Triggered
Threat Hunting
For this part, I used a Raspberry Pi agent as a victim machine. I performed some activities on the agent to trigger events. First, I logged in via SSH and observed the following event:
 Figure 5: SSH Login Event
Then, I added a new user under a new group:
 Figure 6: User Creation Event
An event was also triggered after adding a package:
 Figure 7: Adding a new package
SSH Bruteforce
To trigger higher-level alerts, I executed an SSH brute-force attack from my Kali Linux machine to the agent. After doing so, the threat hunting section of the agent looked like this:
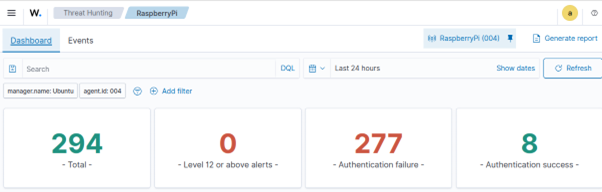 Figure 8: Brute Force Attack
Custom Rules to Detect Reverse Shell
I ran some basic reverse shell attacks against the machine, but no event was triggered. To detect these types of attacks, I created some custom rules. To do so, I edited the /var/ossec/etc/rules/local_rules.xml file and added the following code snippet:
<group name="reverse_shell,custom,">  <rule id="100010" level="12">    <location>command_ps-list</location>    <match>bash -i</match>    <description>Reverse shell detected using bash -i</description>  </rule>
  <rule id="100011" level="12">    <location>command_ps-list</location>    <match>nc -e</match>    <description>Reverse shell detected using nc -e</description>  </rule>
  <rule id="100012" level="12">    <location>command_ps-list</location>    <match>sh -i</match>    <description>Reverse shell detected using sh -i</description>  </rule><rule id="100013" level="12">    <location>command_ps-list</location>    <match>python.*socket</match>    <description>Reverse shell using Python socket</description>    <regex>yes</regex>  </rule></group>
After applying these rules, I tested again, and the event was triggered.
 Figure 8: Reverse Shell Event
Suricata (IDS/IPS) Integration
To enhance network-based threat detection, I integrated Suricata IDS with a Wazuh agent running on an Ubuntu system. Suricata inspects incoming and outgoing traffic in real time and generates alerts for suspicious activity such as port scans, malware communications, and brute-force attempts. These alerts are forwarded as logs to the Wazuh agent, which then parses and sends them to the Wazuh Manager. After doing so, I ran an nmap scan on the Ubuntu machine and obtained the following logs:
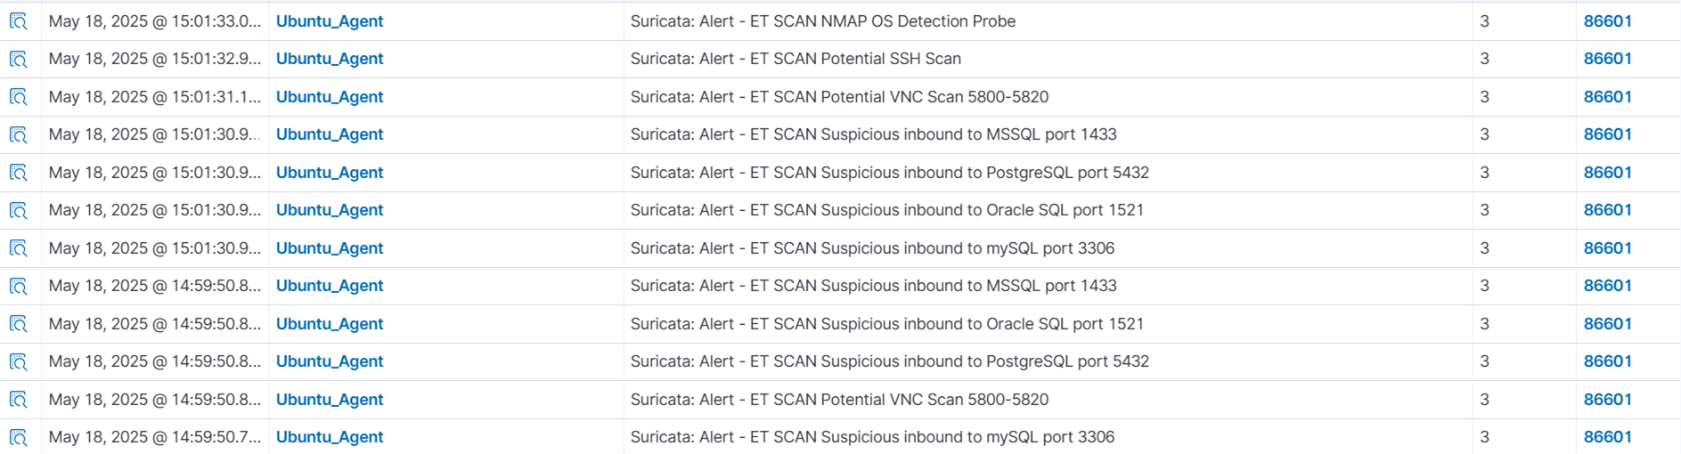 Figure 9: Nmap Scan Events
MikroTik Logs
To extend visibility into the network infrastructure, I integrated MikroTik router logs with the Wazuh SIEM. By enabling the remote logging feature on the MikroTik router, I configured it to forward logs (via Syslog over UDP 514) to the Wazuh Manager. These logs include critical network events such as:
- Login attempts (successful and failed)
- DHCP leases
- Firewall actions
- Interface state changes
Wazuh parses these logs using custom decoders, allowing them to be categorized and correlated alongside agent and IDS data. Here is an example of a log after logging in to the MikroTik router:
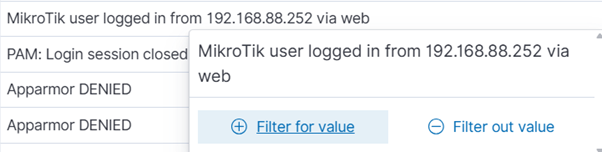 Figure 10: MikroTik Log
Email Alerting with Wazuh
To ensure immediate awareness of critical security events, I configured email alerting in Wazuh following the official alert management documentation. Using the Wazuh Manager’s built-in email notification module, I set up the system to automatically send real-time alerts via email when high-severity events (e.g., level ≥ 10) are detected. I triggered an email by executing a brute-force attack, and this was the result:
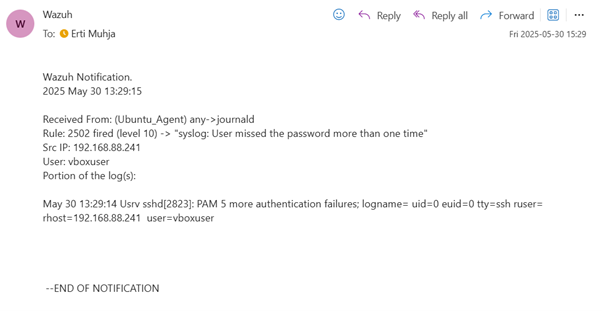 Figure 11: Email Alert
Active Response
In this project, I used Wazuh’s active response feature to respond to attacks and malware.
Detecting and Blocking SSH Brute Force Attack
This setup monitors failed login attempts and triggers an automated firewall rule to block malicious IPs in real time. I followed the use case ‘Blocking SSH Brute-Force Attacks,’ which outlines how to use Wazuh’s built-in firewalldrop script to mitigate attacks.
How It Works:
- Suricata or system logs detect repeated failed SSH login attempts.
- Wazuh triggers a matching rule (e.g., rule ID 5710 or a custom rule).
- The active response module runs the firewalldrop script.
- The attacking IP is automatically added to iptables and blocked for a defined duration.
 Figure 12: Malicious IP blocked
Detecting and Removing Malware with VirusTotal
To strengthen endpoint security, I implemented automated malware detection and response by integrating Wazuh with VirusTotal, following the official proof-of-concept guide. This setup enables Wazuh to scan suspicious files, verify their reputation online, and automatically quarantine or delete confirmed malware.
How It Works:
- Syscheck (File Integrity Monitoring) detects the creation or modification of a file.
- A custom Active Response script is triggered.
- The script computes the file’s hash (SHA256) and queries VirusTotal via its API.
- If the file is reported as malicious (based on a threshold of antivirus detections), Wazuh automatically:
- Logs the event
- Deletes or quarantines the file
I ran a test using a file called eicar, which triggered this response.
 Figure 13: Malware detected and removed